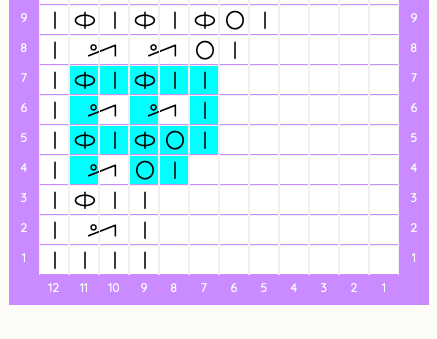
Just a little glitch I noticed in tunisian charts. I’m trying to highlight a group of symbols to show the pattern repeat. As per attached screenshot, when I make a 2 grid symbol a different colour, it’s only doing the one grid space in that colour, not both.
I think highlighting symbols like this is the only way to currently show a pattern repeat. Would you agree? I would love the ability to make a coloured box around a pattern repeat instead of colouring the symbol background (because it’s a bit clunky to do that). Do you think that would be possible one day?
Thanks for reporting Abbey!
The fix for this issue will be released on our upcoming update, as well as an additional space to add a note for your chart.
With regards to visually marking sections of a chart - that is something we are considering, although could take time.
If you want to fill an entire section with color what you can do is simply draw the outline only using a chosen color, then right click within the shape and select the fill option. This should hopefully save you a lot of time!